
Visual Studio 2008 Debugging Tricks – Tracepoints
- 2 minutes to read
- edit
We have talked about the Location, Condition, Hit Count, and Filter modifiers for breakpoints which only leaves the When Hit modifier. Using the When Hit modifier allows you to change your breakpoint to a tracepoint.
What is a tracepoint? Simply put, it is a breakpoint that continues execution. Why would this be interesting or even important? Tracepoints are great when you want to trace a particular path of execution, such as OnDeserialized events in your WCF DataContract classes. You are interested in watching the order your objects are deserialized to ensure that everything is happening when you expected it to occur.
In this scenario, you aren’t really interested in stopping the execution. Ordinarily you could achieve this by inserting Trace.WriteLine (or even Console.WriteLine or Debug.WriteLine) calls throughout your code. While this would work it means that you are adding lines of code just for debugging purposes (so hopefully they would only be needed temporarily) which means you need to remember to remove them when you are done debugging. Wouldn’t it be great if you could simply set a breakpoint to execute Console.WriteLine (or some equivalent) to display a message in our Output window?
That’s exactly what a tracepoint does, but it can do a lot more than just that.
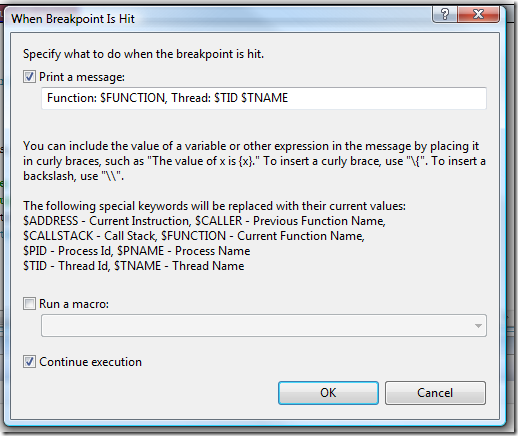
The When Breakpoint Is Hit dialog allows you to simply print a message, but that message can contain special keywords and can also evaluate methods and properties of any object that is in scope when the tracepoint is hit. In addition to printing a message, you can also run a macro. By default a tracepoint is intended to continue execution, but you can change that as well which will effectively give you a breakpoint which will print a message and/or execute a macro before breaking.