
Visual Studio 2008 Debugging – Advanced Tricks
- 7 minutes to read
- edit
We previously talked about the Location, Condition, Hit Count, Filter, and When Hit modifiers for breakpoints. These are great advanced breakpoints that will really make your debug sessions much more useful, but there are also some other advances in Visual Studio that go beyond these breakpoint modifiers.
The first advance is the idea of advanced location breakpoints. How many times have you been debugging an issue and as you’re looking at the call stack you realize that you want to set a breakpoint somewhere higher up in the call stack? This is really useful when you want to let execution continue but want to stop part way through the return sequence from some lower-level function.
In order to accomplish this you would ordinarily have to find the source file in the solution explorer, then find the function you are interested in and set your breakpoint. Yes, you can simplify this by double-clicking the line in the call stack, which will take you to that line in the source code but then you loose the context of your current location.
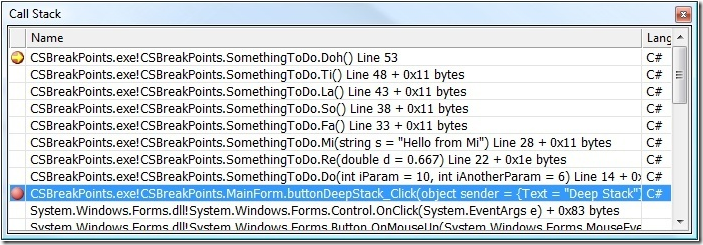
Well, Visual Studio allows you to select the line in the call stack and press F9 (on the default keyboard, this is the keyboard shortcut to insert a breakpoint) and a breakpoint will be inserted at the appropriate location in code. You can also right click on the stack item and choose Run to Cursor.
This is great, but what about trying to set a breakpoint on a line that contains sub expressions, such as a foreach loop. A foreac loop is actually comprised of 3 sub expressions. If you click the gutter to set a breakpoint it sets it on the first sub expression on the line.

How do you set a breakpoint on another sub expression? For instance, if I wanted to set a breakpoint on the workerSettings.Tasks property in the foreach statement. By selecting the sub expression (or simply putting your cursor anywhere in that sub expression) and pressing F9 you will set a breakpoint only on that sub expression.

Let’s now look at a concept that can only be called dynamic assertions. Hopefully you are familiar with the Debug.Assert and Trace.Assert methods which allow you to halt program execution given a specific Boolean condition. While these are useful they aren’t very dynamic and can’t be very complex. But what happens if you want to hit a breakpoint when an error condition occurs in your application that needs to take in to account multiple factors?
If you remember from our discussion on the Condition modifier you can set the condition expression to any any valid Boolean expression. This means that you can also set the condition to be the result of a method call, as long as that method returns a Boolean value. In order to do this, you need to add a method that returns a Boolean. This method should return true if an error condition exists. (Basically, it should return true when you want the breakpoint to hit.)
#if DEBUG
public bool CheckName()
{
  if (this.name == null)
  {
  return true;
  }

  return false;
}
#endif
Notice that I didn’t use the ConditionalAttribute("DEBUG") syntax here. The reason for this is that this attribute only works for void return types. Now that we have this method defined, you can use it as the condition expression
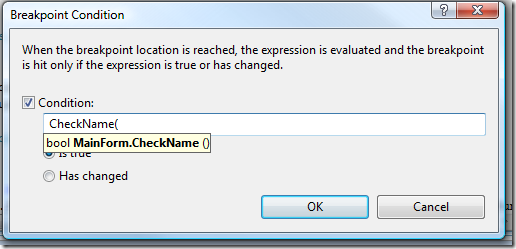
You also get some IntelliSense help showing that this is the correct method and you can verify that the condition is set correctly by looking at the Breakpoints window

Now, whenever the result of CheckName() is true, the breakpoint will be hit. This allows you to create some really complex and powerful debug conditions for your breakpoints.
Finally, we need to take a look at the New Breakpoint dialog. This is probably the most powerful and underutilized feature of the debugging system. Most of the developers that I know open files and scroll around until they find the line of code that should contain a breakpoint. In at least half of those times (if not more) they already know the function that should contain the breakpoint and generally want to set the breakpoint at the start of the function. This is where the New Breakpoint dialog can really help.

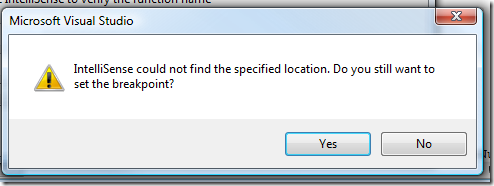
As you can see from the dialog, you can simply type the name of the function (this can be either a method or a property) which will contain your breakpoint. Unfortunately you don’t get any IntelliSense help while typing the function (like you do in the Breakpoint Condition dialog) but if you leave the “Use IntelliSense to verify the function name” checkbox checked it will display a warning message if you get the name wrong.
While this can save a lot of scrolling through files to find the right function, it does require you to know the fully qualified method name, which means you must know both the class and method name. What happens if you don’t know what class the method is in or you have multiple methods of the same name where you want to set breakpoints? As long as you have a project loaded, you can simply type the function name and a Choose Breakpoints dialog will display.
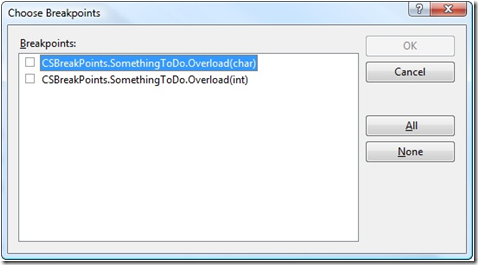
From this dialog, you can see all of the functions that match the name from all classes.