
Visual Studio 2008 Debugging Tricks – Multi-Threaded Debugging
- 4 minutes to read
- edit
We previously talked about the Location, Condition and Hit Count modifiers for advanced breakpoints. These are great for a lot of different debugging scenarios, but what about tricks specifically for debugging multi-threaded applications. If you have ever tried to debug a multi-threaded application you know that it isn’t always the easiest experience.
Hopefully everyone is already familiar with the Treads window. If you aren’t, it is accessed through the Debug | Windows | Threads menu or the Ctrl+D, T keyboard shortcut. The threads window is only available when you are actively in a debug session.
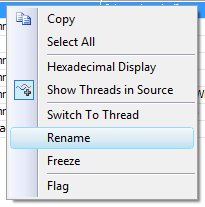 The Threads window provides a few useful tricks of it’s own that you might not be aware of. The first three tricks are available from the context menu.
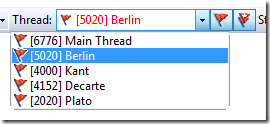
You can freeze threads to avoid bouncing around when single stepping and you can switch to a specific thread.
Giving threads meaningful names is very helpful in helping to identify your threads and not all threads have a meaningful name (or in some cases, they don’t have a name at all). Fortunately, you can rename threads directly from the Threads window as well. You can do this using either the Rename context menu or simply clicking in the Name column and typing.
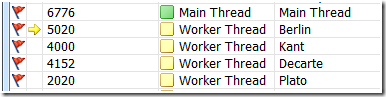
The Threads window also makes it easier to identify the main and worker threads by using the green and yellow color squares. Perhaps the most interesting new feature is the ability to flag threads. Once a thread is flagged, you can use use the Debug Location toolbar to only display those flagged threads. This is a great simplifying option for applications that have a lot of threads.
One other benefit of the Threads window is that by hovering the mouse over the Location column (or the current thread indicator, which is the yellow arrow) you can see the call stack for that thread. This is really useful if you just need to check the call stack quickly and don’t actually want to switch to that thread.
One last trick to mention is the Show Threads in Source option. 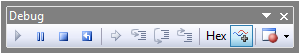 This is available from the Threads window context menu and also the Debug toolbar.
When this option is turned on you get some very nice visual indicators to show information about your threads. If you look carefully, you will see that the breakpoint symbol actually has a red and blue squiggly line through it and, just below that you see a similar marker. If you hover the mouse over the threads marker you will see a debug tool tip that shows you all of the threads that are executing at that location. If you notice there are also some source code lines shaded in grey, which indicates that another thread is executing at the same location.
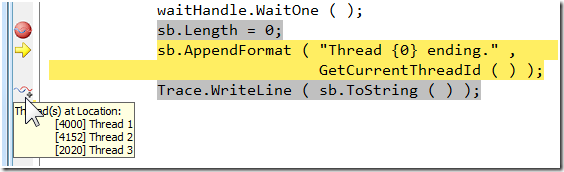
One word of caution with the Show Threads In Source option: You must have this option enabled before your debug session begins in order for it to behave correctly.
Now, let’s take a look now at the Filter modifier. This is used to restrict the breakpoint to only being set in certain processes and/or threads. When you choose the filter modifier, the Breakpoint Filter dialog is displayed
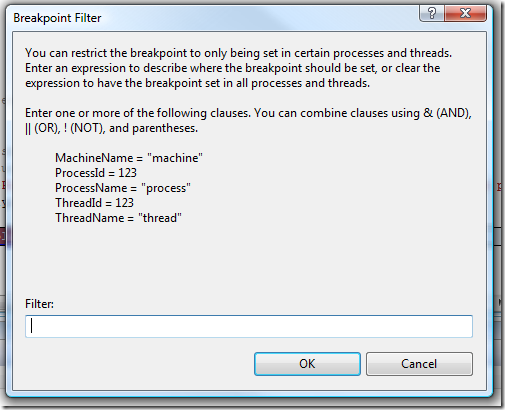
which allows you to specify the machine name, process id (or name), and/or the thread id (or name). Using the threads shown earlier, if we wanted to restrict a breakpoint to only being set in Thread 3 we could set the filter to either of these expressions:
- ThreadId = 2020
- ThreadName = “Thread 3”
Two important things to be aware of here are that the machine/process/thread keywords are case insensitive and that the “==” operator is supported.