
Visual Studio 2008 Debugging Tricks – Advanced Breakpoints
- 7 minutes to read
- edit
The most basic aspect of any debugging session is the use of breakpoints, which allows you to specify a location in your application (a line of code) where program execution will stop (break) and allow you to inspect the internal state of the application at that exact moment. This is a pretty cool feature, but Visual Studio allows you to do even more with advanced breakpoints.
 Put simply, an advanced breakpoint is a breakpoint with one or more modifiers applied. A modifier allows you to change the runtime actions or conditions that will cause the breakpoint to be triggered, or in some cases even set.
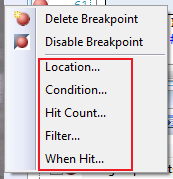
In order to set an advanced breakpoint, you must first set a normal breakpoint and then choose a modifier to set from a context menu. To display the context menu from a breakpoint symbol in the gutter, simply right mouse-click the breakpoint symbol or the line containing the breakpoint to display the context menu. If you are using the Breakpoints window, right mouse-click the row containing the breakpoint to display a similar menu.
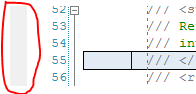
Just in case you aren’t familiar with the terminology, the gutter is the gray vertical area just to the left of the code in the editing window and is circled in red in the picture. This area is used to provide visual indicators for breakpoints and other information that is useful or important during a debugging session.
Now that we know where our debugging indicators appear, let’s take a look at the different symbols that Visual Studio uses. I’m sure everyone is familiar with the normal breakpoint symbols, both enabled and disabled, but there are seven other symbols that can be displayed. The complete list of breakpoint symbols is:
 |
Normal breakpoint [enabled and disabled] |
| <img src=”/img/posts/2009/2009-02-14-visual-studio-2008-debugging-tricks-advanced-breakpoints/image42-2.png) | Advanced breakpoint (hit count, condition, filter” alt=”” title=””> property set |
 |
Mapped breakpoint in ASP/ASP.NET and mapped to an HTML page |
 |
Normal tracepoint |
| <img src=”/img/posts/2009/2009-02-14-visual-studio-2008-debugging-tricks-advanced-breakpoints/image48-2.png) | Advanced tracepoint (hit count, condition, filter” alt=”” title=””> property set |
 |
Mapped tracepoint in ASP/ASP.NET and mapped to an HTML page |
| <img src=”/img/posts/2009/2009-02-14-visual-studio-2008-debugging-tricks-advanced-breakpoints/image52-2.png) | Breakpoint or tracepoint error (the BP or TP will never be set” alt=”” title=””> |
| <img src=”/img/posts/2009/2009-02-14-visual-studio-2008-debugging-tricks-advanced-breakpoints/image54-2.png) | Breakpoint or tracepoint warning (generally means the source location is not currently in any loaded module” alt=”” title=””> |
(Don’t worry about tracepoints yet, we will cover them in a follow-up post.)
Now that we know how to set an advanced breakpoint, lets explore why these breakpoints are useful and take a more in-depth look at the different modifiers.
Let us look first at the Location modifier. This is actually a normal breakpoint, but the File Breakpoint dialog allows you some additional control.
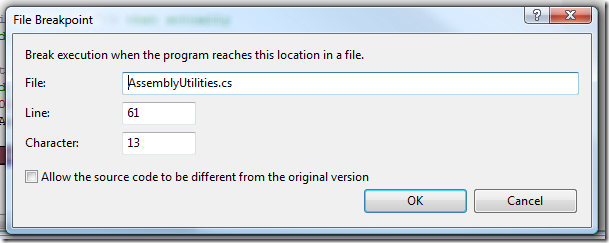
The most interesting option here is that you can allow the breakpoint to be hit even if the source code is different than the executing code.
Now that we have that out of the way, lets look at the Condition and Hit Count modifiers. Suppose, for example, that you are debugging an issue that occurs somewhere during a loop execution. You have narrowed the problem down to the loop itself and the fact that it occurs only when a certain Boolean condition occurs. Normally you would debug this by setting a breakpoint at the start of the loop and then stepping through each iteration until the condition occurs. This scenario might be acceptable if the loop only executes a few times, but what happens if it executes 100 times or, even worse, the loop executes 100 times and the condition isn’t true until the 80th iteration through the loop.
This is a perfect time to use an advanced breakpoint. Since you already know the error occurs during a certain condition, you can use the condition modifier. Choosing this modifier displays the Breakpoint Condition dialog
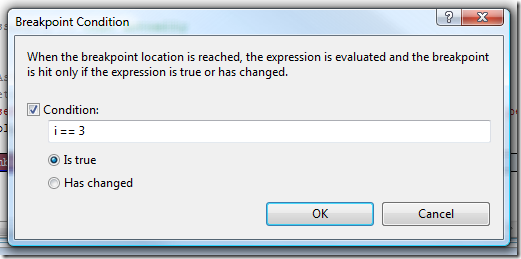
which allows you to restrict when the breakpoint will hit based on the evaluation of a Boolean expression. You can choose to hit the breakpoint when the condition is true or when the result of the condition has changed.
One thing to remember about the condition expression is that the source language determines the expression operators. This means that if you are debugging in Visual Basic, the “<>” operator means “not equal” while in C# or C++/CLI, you would use “!=”.
Another option is to set a breakpoint on the hit count. The hit count is the number of times the breakpoint location has been hit. By setting the hit count modifier, the breakpoint will only hit when the condition is satisfied.
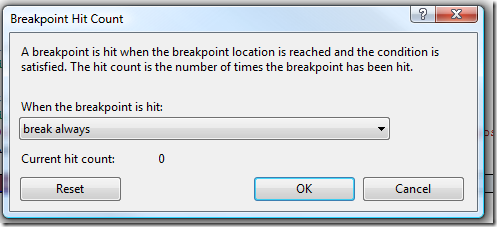
By default, the condition is “break always” which causes this to behave like a normal breakpoint. However, if you change the condition, you are able to specify a value.
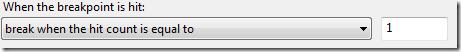
In this case, the breakpoint will be hit only once (when the hit count is equal to 1). The complete list of options are:
- break always: Behaves just like a normal break point.
- break when the hit count is equal to: Stop only when the hit count equals the initial value.
- break when the hit count is a multiple of: Stop every x times (think modulo).
- break when the hit count is greater than or equal to: Continues to stop after equaling the initial value.
Let’s take a quick look at the Breakpoints window. If you aren’t familiar with it, you can display it through the Debug | Windows | Breakpoints menu option or the Ctrl+D, B keyboard shortcut.
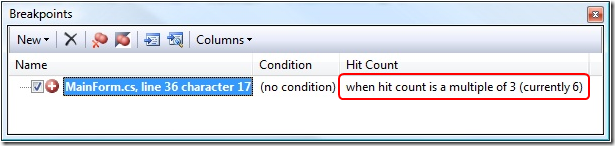
The reason why the Breakpoints window is important for advanced breakpoints is that you can see additional information about the breakpoint, such as the condition and the hit count. In the case of a hit count modifier, it also shows the current number of hits.
The Filter and When Hit modifiers are covered in more detail in parts 2 and 3, respectively.